It’s difficult for a team with such a prestigious history to distinguish itself, but this year’s Yellowjackets are doing something more efficiently than any URWB team since at least 2003—scoring the ball.
They are scoring at a rate of 100.6 points per 100 possessions, a five-point increase from last season, and the second time they’ve exceeded 100 in this figure, which is also known as ORtg, in the studied timespan.
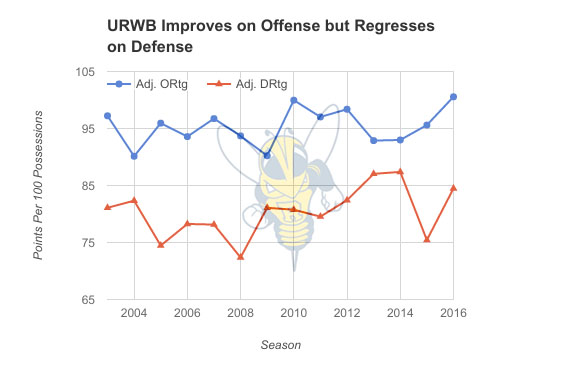
URWB has both scored and allowed more points per possession this season.
At the same time, the team’s defense has allowed an adjusted ORtg of 84.5 points per 100 possessions, which is more than the typical URWB team but still a strong figure in Division III. It is also, however, nine points worse than that of last year’s squad.
Previously, we looked at how UR Men’s Basketball fared versus its program history in Dean Oliver’s Four Factors. The same can be done for URWB. Instead of using Z-scores, as done previously, the estimated percentile within program history will be estimated (using a normal distribution).
So, for example, if a statistic is in the 80th percentile, this is equivalent to that team outperforming 80 percent of URWB teams in that statistic (even though only 14 seasons were sampled, one can scale up to 100).
The rows of the attached table contain an offensive, defensive, and net version of each statistic. Defensive statistics pertain to what the team allowed opponents to do in that area, and the net statistic is the difference between the offensive and defensive statistics.
| Percentile | ORtg | Pace | Efg% | TOV% | ORB% | FT/FGA |
|---|---|---|---|---|---|---|
| Offense | 95% | 88% | 96% | 86% | 30% | 68% |
| Defense | 17% | 88% | 56% | 10% | 51% | 19% |
| Net | 42% | — | 86% | 18% | 28% | 26% |
As mentioned before, the ‘Jackets are doing exceedingly well on offense, with a performance in the 95th percentile in ORtg, but their DRtg (opponent ORtg) is in the 17th percentile, putting their net rating at the 42nd percentile. One should keep in mind, however, that they are still outscoring opponents by a significant 16 points per 100 possessions.
They have achieved their offensive prowess primarily through lights-out shooting and limiting turnovers. Beside effective field-goal percentage, another measure of shooting efficiency is PPWS (points per weighted shot), which divides total points by shot attempts (free throws are counted as .475 shooting attempts). This season’s team has produced 1.01 PPWS.
A benefit of using PPWS is that it can provide an idea of what the team’s ORtg would be if shooting was all that mattered in offense. If that were case, the team would score 100.9 points per 100 possessions, which is right in line with its actual ORtg.
This means that other aspects of the team’s offense—turnovers, offensive rebounding, and free throw frequency—are roughly cancelling out. It should be kept in mind that shooting is the best predictor of offensive performance, so these numbers have at the very least high correlation.
The team has limited opponent shooting as in years past, but it hasn’t produced nearly as many turnovers as usual. In fact, the ‘Jackets’ opponents have caused two more turnovers per 100 possessions than their rivals—and they are already turning over the ball at a low clip on offense.
There are many limitations when studying a team’s performance relative to its own instead of against league-wide data—trends from season-to-season are able to provide better context. For example, the league average for ORtg could be 90 in one season, and 95 a few seasons later.
More stable, however, are net statistics, found in the third row of the table. Going back to turnovers, it’s clear that it is not URWB’s strongest area. However, its edge in effective field goal percentage is certainly apparent.
When offense and defense are considered simultaneously, this season’s team is in line with URWB tradition almost exclusively because its shooting, and despite lukewarm performances in other areas.
There are many factors behind all of these statistics, whether it be league-wide trends, what a coach values the most, and, of course, the playing style and strengths of the personnel.
Keeping in mind that shooting is the strongest predictor of success in basketball, the Yellowjackets have certainly recruited well.
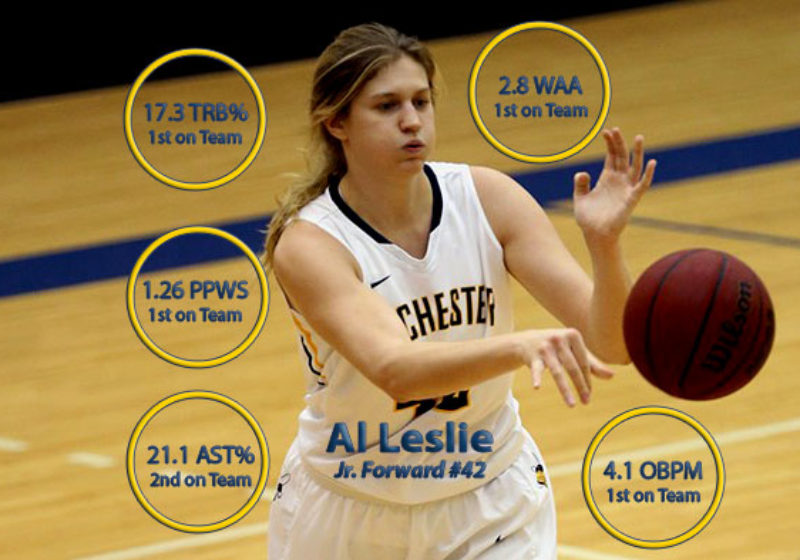
Junior forward Al Leslie, who certainly does more than shoot, leads the team with 1.26 PPWS. Guard and fellow junior Lauren Deming is second at 1.11, and freshman guard Lauren Foley is right behind at 1.10.
Foley is one of four Yellowjackets with a 3-point attempt rate above .500. (This is the ratio of 3-point attempts to overall field goal attempts.) A full 72 percent of her field goal attempts have come from behind the line, and the team as a whole is attempting them at its highest recorded rate.
Considering the current basketball trends, being led by teams such as the Golden State Warriors, 3-pointers are a strong area to invest in. After all, making 33 percent of your 3-point shots is just as valuable as making 50 percent of 2-point shots. The team, in this regard, has picked their shots almost perfectly. The ratio of their 2-point field goal percentage (.463) and their 3-point field goal percentage (.316) is 1.47.
Ideally, a team with a ratio below 1.5 would continue to trade off higher percentage looks on 2-pointers for more difficult 3-pointers until the ratio reached 1.5. (A team could have a 3-point percentage much closer to their 2-point percentage if they only attempted 3-pointers given wide-open looks, but it would still benefit from attempting slightly more difficult shots from beyond the arc, given the 3:2 points ratio from making a shot.) URWB’s ratio is right in the wheelhouse for efficiency, so there’s no reason for its players to change their shooting habits.
Leslie, who is 10th in Division III in scoring at 22.2 points per game and has won UAA player of the week four times this season, also leads the team in total rebound percentage (estimated percentage of total rebounds grabbed by a player when they are on the court), with a percentage of 17.3. Deming is second at 14.9 percent, which is exceptional for a guard.
The statistic can be broken up into offensive and defensive rebounding. Leslie, junior forward Mary Kronenwetter, and sophomore guard Lena Ethington each broke 10 percent in offensive rebounding. Meanwhile, Leslie and Deming broke the 20-percent mark in defensive rebounding (which is far more frequent than offensive rebounding).
Deming just eclipses Leslie in assist percentage (the estimated percentage of teammate field goals assisted by a player while they are on the floor), 21.6 to 21.1. Leslie, however, had by far the best turnover percentage on the team, coughing up the ball only 9.1 percent of the time. For another indicator of how efficient her play has been, consider that she leads the team in both block percentage (4.0) and lowest foul percentage (2.2).
Ethington and freshman guard Brenna James have caused turnovers on defense most frequently, each stealing the ball on at least three percent of possessions. Steals, it should be noted, are more valuable than other turnovers to the team causing them, since they give the offense efficient fast-break potential while also ending the opponent possession with no points.
Finally, a player’s tendency to end plays on offense (via shot attempt or turnover) is shown in usage rate. Unsurprisingly, Leslie leads the team at .307, with Deming in second at .248.
Combining all advanced individual stats that have been mentioned thus far, one can calculate a players’ Box Plus-Minus. Normally, a plus/minus in basketball is just the team’s net scoring while the player is on the floor. However, there are a huge amount of factors in play, especially quality of one’s’ team and their opponent. Starting in the NBA, a statistic called RAPM was used (Regularized Adjusted Plus-Minus), which now has a sort of successor in ESPN’s RPM (Real Plus-Minus).
They both treat each player as an independent variable, trying to isolate for the player’s effect on plus-minus while on the court (the league average should always be zero). This means a large sample size is needed, since it’s difficult to isolate one player’s performance while 10 are on the court. For this reason, data from the previous season also plays into the statistic.
To do the same for URWB, uniformly stored play-by-play data would be needed for, at the very least, every team on their schedule. In fact, despite the many advanced statistics sites for Division I, a similar statistic hasn’t been calculated because of the sheer amount of teams and players.
Instead, one needs to do a bit of approximation. Basketball Reference’s BPM (Box Plus-Minus) uses the aforementioned statistics, and regresses them to get coefficients toward RAPM. For example, 10 additional percent points in defensive rebounding may be worth a point in BPM (although the formula has a few parts, so such a translation can’t really be made).
After calculating a raw OBPM and DBPM (offensive and defensive components, which, when combined, give the overall BPM) for each player on roster, the team’s actual offensive and defensive performance versus league average must be considered. Here, we used URWB’s schedule-adjusted offense and defense to make this calculation, so that strength of schedule played into the statistic. So the following numbers will be relative to the average women’s college team.
The result is that Deming and Leslie lead the team with BPMs 7.6 and 7.4, respectively. Leslie leads the team in OBPM at 4.1, and junior forward Jillian Silvestri has a team-high 4.1 DBPM. To give an example, if Leslie played with an otherwise average team for 100 possessions, that team would now outscore opponents by 7.4 points over that span, instead of breaking even.
From here, two additional extensions can be made. Multiplying BPM by the fraction of total team minutes that the player logged gives PAA, or points above average. Since Leslie has played more minutes than Deming, she’s been worth more PAA (which also has offensive and defensive components that are used in minor ways in the final calculation).
Finally, one can subtract the players’ PAA contributions from the team’s points scored and allowed for the season, and find how the team would’ve done without them. Subtracting this from the team’s’ actual performance gives WAA (wins above average). The leaders in the statistic are shown in the table below.
| Player | WAA |
|---|---|
| Al Leslie | 2.8 |
| Lauren Deming | 2.5 |
| Lena Ethington | 1.2 |
| Mary Kronenwetter | 0.8 |
| Jillian Silvestri | 0.8 |
This statistic attempts to say what record an otherwise .500 team (against a .500 schedule) would have if they added that player. So, considering that the ‘Jackets have played 24 games thus far, a 12–12 team would now go 15–9 if it added Leslie, which is a hugely significant contribution.
An important thing to note with WAA and BPM is that they’re not simply comparing a team or lineup with that player to one without the player—they’re comparing to one with a league average player replacing them. So saying a perfectly adequate player (who isn’t someone all that easy to find), in Leslie’s place, would be worth three fewer wins in a 24 game–span, truly underscores her value.
With her and other members of URWB, you don’t need to look this hypothetically to see how valuable they are. But it does put their performance in perspective.