Advanced statistics are easy to find for NBA players, along with the majority of Division I programs, if one knows where to look.
It’s much more difficult to find them for Division III schools like UR. So we calculated them.
Note that these metrics are the least advanced that can be called advanced—more detailed statistics can be obtained when looking at play-by-play or even player tracking data. The ones we will be referring to, however, can be calculated from basic box score statistics.
On its way to a 19–1 start, UR Men’s Basketball (URBB) has picked things up, playing at a pace of 70.8 possessions per 40 minutes, compared to an average of 64.7 for the 2003-15 seasons. (This is the timespan for which enough data is available, so when we refer to program history, this is what we mean.)
In other words, the team is finishing possessions in 1.7 fewer seconds on average.
This hasn’t made its offense any less efficient—when adjusted slightly for strength of opponent, its ORtg (offensive rating, or points per 100 possessions) comes out to 113.7, the best mark since URBB legend John DiBartolomeo’s senior season in 2012.
Overall, it’s a strong figure, but not a hugely notable one relative to program history, given that the historic average is 111.8.
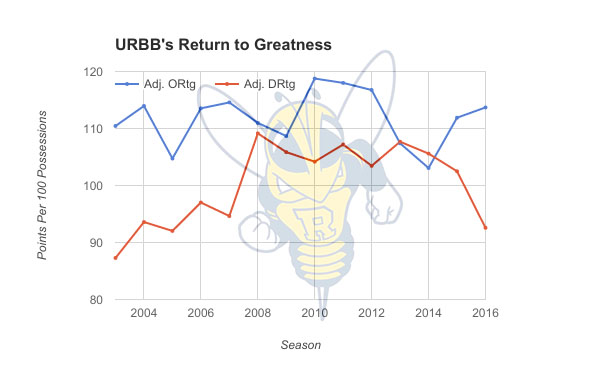
URBB’s adjusted offensive and defensive ratings have vastly improved this season
Where the team truly shines is on defense. Its adjusted DRtg (the offensive rating the players have allowed) is not only below 100 for the first time since 2007, but sits at 92.6, well below the program average of 100.8.
The performance of the team on both sides of the ball can be evaluated using the Four Factors method, developed by statistician Dean Oliver. They will be mentioned in Oliver’s hypothesized order of importance.
The included table should serve as a guide when looking at each section. In the table, each factor, along with each offensive rating, is listed twice—once for the ‘Jackets (offense), and once for the performance of their opponents (defense). Additionally, each statistic will be accompanied by a z-score in parentheses. This is the number of standard deviations the statistic is above the team’s mean performance during the evaluated seasons.
| ORtg | Pace | eFG% | TOV% | ORB% | FT/FGA | |
|---|---|---|---|---|---|---|
| Offense | 114.6
(1.06) |
70.8
(2.27) |
.573
(1.35) |
17.6
(0.89) |
25.6
(-1.37) |
.225
(-0.77) |
| Defense | 89.6
(1.30) |
70.8
(2.27) |
.442
(1.06) |
22.6
(1.02) |
26.5
(1.08) |
.218
(-0.39) |
For context, a z-score of 1 means the relevant statistic should be in the 84th percentile, while a z-score of -1 is the inverse, meaning it would be in the 16th percentile. For statistics where a higher value is worse, such as turnovers and most defensive metrics, we have negated z-score. This way, a positive value always accompanies performance conducive to winning (with the exception of pace, which doesn’t predict win probability).
Shooting (eFG Percentage)
EFG (Effective Field Goal) Percentage, is a way of measuring the percentage of field goals that gives additional weight to 3-pointers, though they are only worth 2.5 points in the equation. This way, it gives a better snapshot of shooting efficiency than normal field goal percentage.
Despite the positive weight on 3-pointers, big men have a significantly higher eFG percentage on average than guards—this simply comes from taking more high-percentage shots closer to the rim.
Nonetheless, senior guard Mack Montague, who leads the team in field goals attempted and USG percentage (usage percentage, the percentage of the team’s’ possessions ended by the player while they’re on the court) is slightly above the team average with an eFG percentage of .575.
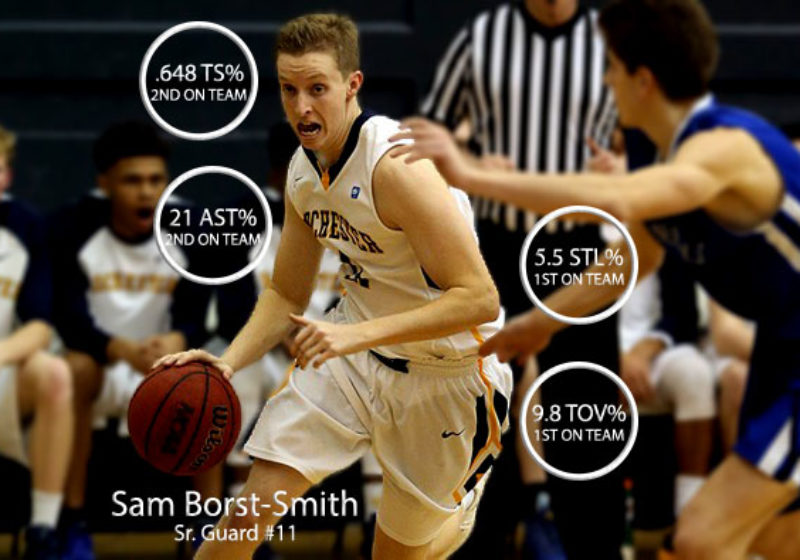
Fellow senior guard Sam Borst-Smith has a lower usage rate but has an impressive eFG percentage of .627. This is second on the team behind senior forward Zack Ayers, who stands at .649.
The ‘Jackets have held their opponents to a vastly inferior .442 eFG percentage. Essentially, they are making 13 more shots per 100 attempts than they are allowing, adjusted for point-value of the shots.
Looking at individual box-score statistics to explain defensive performance is difficult, with the only relevant one being block percentage, the estimated percentage of opponent 2-point field goal attempts blocked by a player while they are on the floor.
Junior forward Tucker Knox is by far the team’s best shot-blocker, with an excellent block percentage of 8.6. In addition, he’s the only member of the team with more blocks than personal fouls, a testament to his strong positioning on defense. Ayers, meanwhile, has held his own with a solid 5.9 block percentage, as the two forwards have limited opponent shots at close range, where they could be most harmful.
One can also infer that the team’s wing players have closed out well on shooters, since opponents are only shooting 29 percent on 3-pointers. Wherever foes look for shot opportunities in the half-court, they can expect consistent pressure from URBB defenders.
Dean Oliver gave eFG percentage a weight of 40 percent to approximate its importance among the Four Factors. In fact, most statisticians on online forums opine that this weight should be significantly higher.
All else equal, shooting efficiency is the highest determiner of a team’s ability to win games. The ‘Jackets have the best differential in this stat, so shooting efficiency is clearly the main source of their success.
Turnovers (TOV percentage)
Turnover (TOV) percentage, is, as its name suggests, the percentage of offensive plays resulting in a turnover. This is another area where the ‘Jackets have a strong edge over opponents.
When the stat is applied individually, it is meant to estimate the percentage of possessions used by a player (see USG percentage) that end in a turnover. As a result, the team’s TOV percentage is approximately the average of its player, weighted by the number of possessions a player uses.
Montague and Borst-Smith have set the tone with respective TOV percentages of 13.4 and 10.1. Borst-Smith’s team-low figure is all the more impressive when accounting for his assist percentage (the percentage of field goals by teammates that the given players assisted on while on the court) of 20.7.
Freshman guard Jacob Wittig is the only ‘Jacket with a higher assist percentage at 25.9. While his TOV percentage is higher than Montague’s or Borst-Smith’s, it is still better than the team average, which means he is creating far more opportunities for his teammates than for the opposition with his passing.
On defense, not all opponent turnovers are from steals. In fact, a reasonable expectation is that half of turnovers are caused by a steal. A steal leads to higher offensive efficiency on the next possession since it is likely to be a fast break opportunity. FiveThirtyEight calculated that one more steal per game by a player is, on average, of as much value to a team’s winning percentage as nine more points per game by that player. The explanation for this is convoluted, but steals are incredibly beneficial plays and are highly indicative of a player’s intangible defensive impact.
This reflects well on Borst-Smith, who leads the team with a steal percentage (or steals per 100 opponent possessions) of 5.7. Just like Knox with blocks, he is the only ‘Jacket with more steals than personal fouls. He is not only aggressive on defense—he is precise.
That a turnover ends an offensive possession and can lead to fast-break points is why TOV percentage is evaluated as the second most important of the Four Factors.
As a result, it is again to the ‘Jackets’ particular benefit that they’ve been relatively strong in this area on both sides of the ball.
Rebounding (ORB percentage):
Offensive rebounding (ORB) percentage measures the percentage of possible offensive rebounds gathered by a team. Offensive rebounding is always more difficult than defensive rebounding, so a strong figure would actually be somewhere in the 30-40 range, depending on the league.
Despite its impressive play overall, this is one area URBB could certainly stand to improve. Possibly, the team hasn’t focused on this area as much—the ‘Jackets don’t miss many shots relative to opponents on offense, so although this is still a ratio stat, players could be more focused on getting in position for shots than for rebounds. It could also have to do with defensive strategy, since being less aggressive on the offensive boards allows a team to be more prepared for fast breaks on defense.
Nonetheless, that this has been the lowest ORB percentage on record for URBB points to missed second or third opportunities on offense that could make its already deadly offense completely lethal.
Although URBB has outrebounded its opponents overall, the team has still allowed a higher ORB percentage than its managed itself. That this margin is close is both a testament to weak offensive rebounding and relatively strong defensive rebounding. Rebounding may be the main difference between its solid offense and stellar defense. In terms of z-score, it’s the only category where the ‘Jackets have had a negative value on one side of the ball and a positive on the other.
It’s also worth mentioning that Ayers leads the team in both ORB percentage and DRB (defensive rebounding) percentage with marks of 9.3 and 20.7 percent.
Free Throws (FT/FGA)
Free throws per field goal attempt (FT/FGA) is calculated as the name indicates, and show a team’s ability to both get to the free throw line and capitalize on those attempts. Its placement as the least important factor makes sense, not because of the value of free throws but because of the way the statistic is calculated.
Essentially, it measures two things at once—what is called free throw rate (ability to get to the line) and free throw percentage. Having a higher figure in the latter and lower in the former might give you the same FT/FGA, but would disadvantage you in situations in which you need to hit forced free throw attempts after an opponent intentionally fouls you.
Additionally, taking fewer free throws isn’t all that negative a result. On shots from the field, URBB scores around 1.14 points per shot. On free throws, it scores around 1.4 points per trip to the line.
(True shooting percentage is a statistic involving a type of weighted points per shot—it takes shooting from 2-pointers, 3-pointers, and free throws into account, so it is the best indicator of pure shooting accuracy.)
Certainly, the second value is significantly larger, but the disparity isn’t large enough to make the ‘Jackets’ slightly sub-par FT/FGA all that harmful on offense. On defense, their FT/FGA has been in line with previous teams, so they aren’t bailing out opponents all that much.
Overall, URBB does exceedingly well when compared to previous URBB teams, with an above average offensive output and lockdown defense. The only area where its struggles may be significant is offensive rebounding.
Against much of its schedule, this just means that the chances of a loss go from miniscule to small. Against top-tier competition, however, it could make all the difference.